


Want more on Virginia’s population trends? We’ve collected all our demographic coverage in one place.
Mecklenburg County might seem to be a place where nothing is happening.
The latest population estimates for the Southside county put the county’s population growth since the 2020 census at 0.0%.
This is also like looking at the still waters of Buggs Island Lake and not understanding that, beneath the surface, there are mighty currents swirling back and forth.
While Mecklenburg County’s population growth has flatlined, it’s also seen an unusually large influx of newcomers moving into the county, likely a combination of multiple trends: The growth of the Microsoft data center near Boydton, the county’s proximity to the Research Triangle in North Carolina and the general growth of rural populations since the pandemic. Since 2020, some 7% of the county’s households are new, according to the U.S. Census Bureau, a higher percentage than in some counties on the outskirts of major metro areas. In Fauquier County, on the edge of Northern Virginia, 6% of its households since the last headcount are new. Hanover County, within commuting distance of Richmond — same, 6%. Botetourt County, which is largely a bedroom community for Roanoke — again, 6%.
The locality with the fastest growth rate in the state is New Kent County, midway between the Richmond metro and the Peninsula metros of Hampton Roads. Since 2020, New Kent’s population has grown by 16.8% while Mecklenburg’s is absolutely zero, or at least looks that way until you go out three decimal places and that 0.0% turns into 0.001%. Mecklenburg did have a net growth of 33 people in four years. However, since 2020, both New Kent and Mecklenburg now see newcomers constitute 7% of their households.
How can this be? How can Mecklenburg County have such an influx of new people yet show no population growth?
That’s because, metaphorically speaking, there are two types of vehicles on the road in Mecklenburg — moving vans and hearses. Since the last census, Mecklenburg has recorded a net in-migration of 1,050 more people moving in than moving out. Keep in mind that’s a net figure. Based on that 7% figure, it would appear that 2,123 people in Mecklenburg are newcomers since 2020 — but there are also people moving out, so that brings the net down to 1,050, which is still an impressive figure for a rural county. That’s more than twice the net in-migration during that same time as Arlington (347) and Roanoke (391). It’s far more than any of its neighbors. Pittsylvania County to the west and Halifax County to the east saw net out-migration, so they were losing people through moves, while Mecklenburg was gaining at an impressive rate.
The only reason Mecklenburg wound up at 0.0% population growth — or 0.001% if you prefer — is that it’s an aging county and the number of deaths overwhelmed the number of births so much that those deaths balanced out the number of people moving in.
That’s not unusual. Between an aging population and declining birth rates, deaths outnumber births in most localities in Virginia. There are many rural localities in Virginia that have more people moving in than moving out but still are losing population because of the high number of deaths.
If you’ve followed our demographic coverage, you have likely seen these maps before: 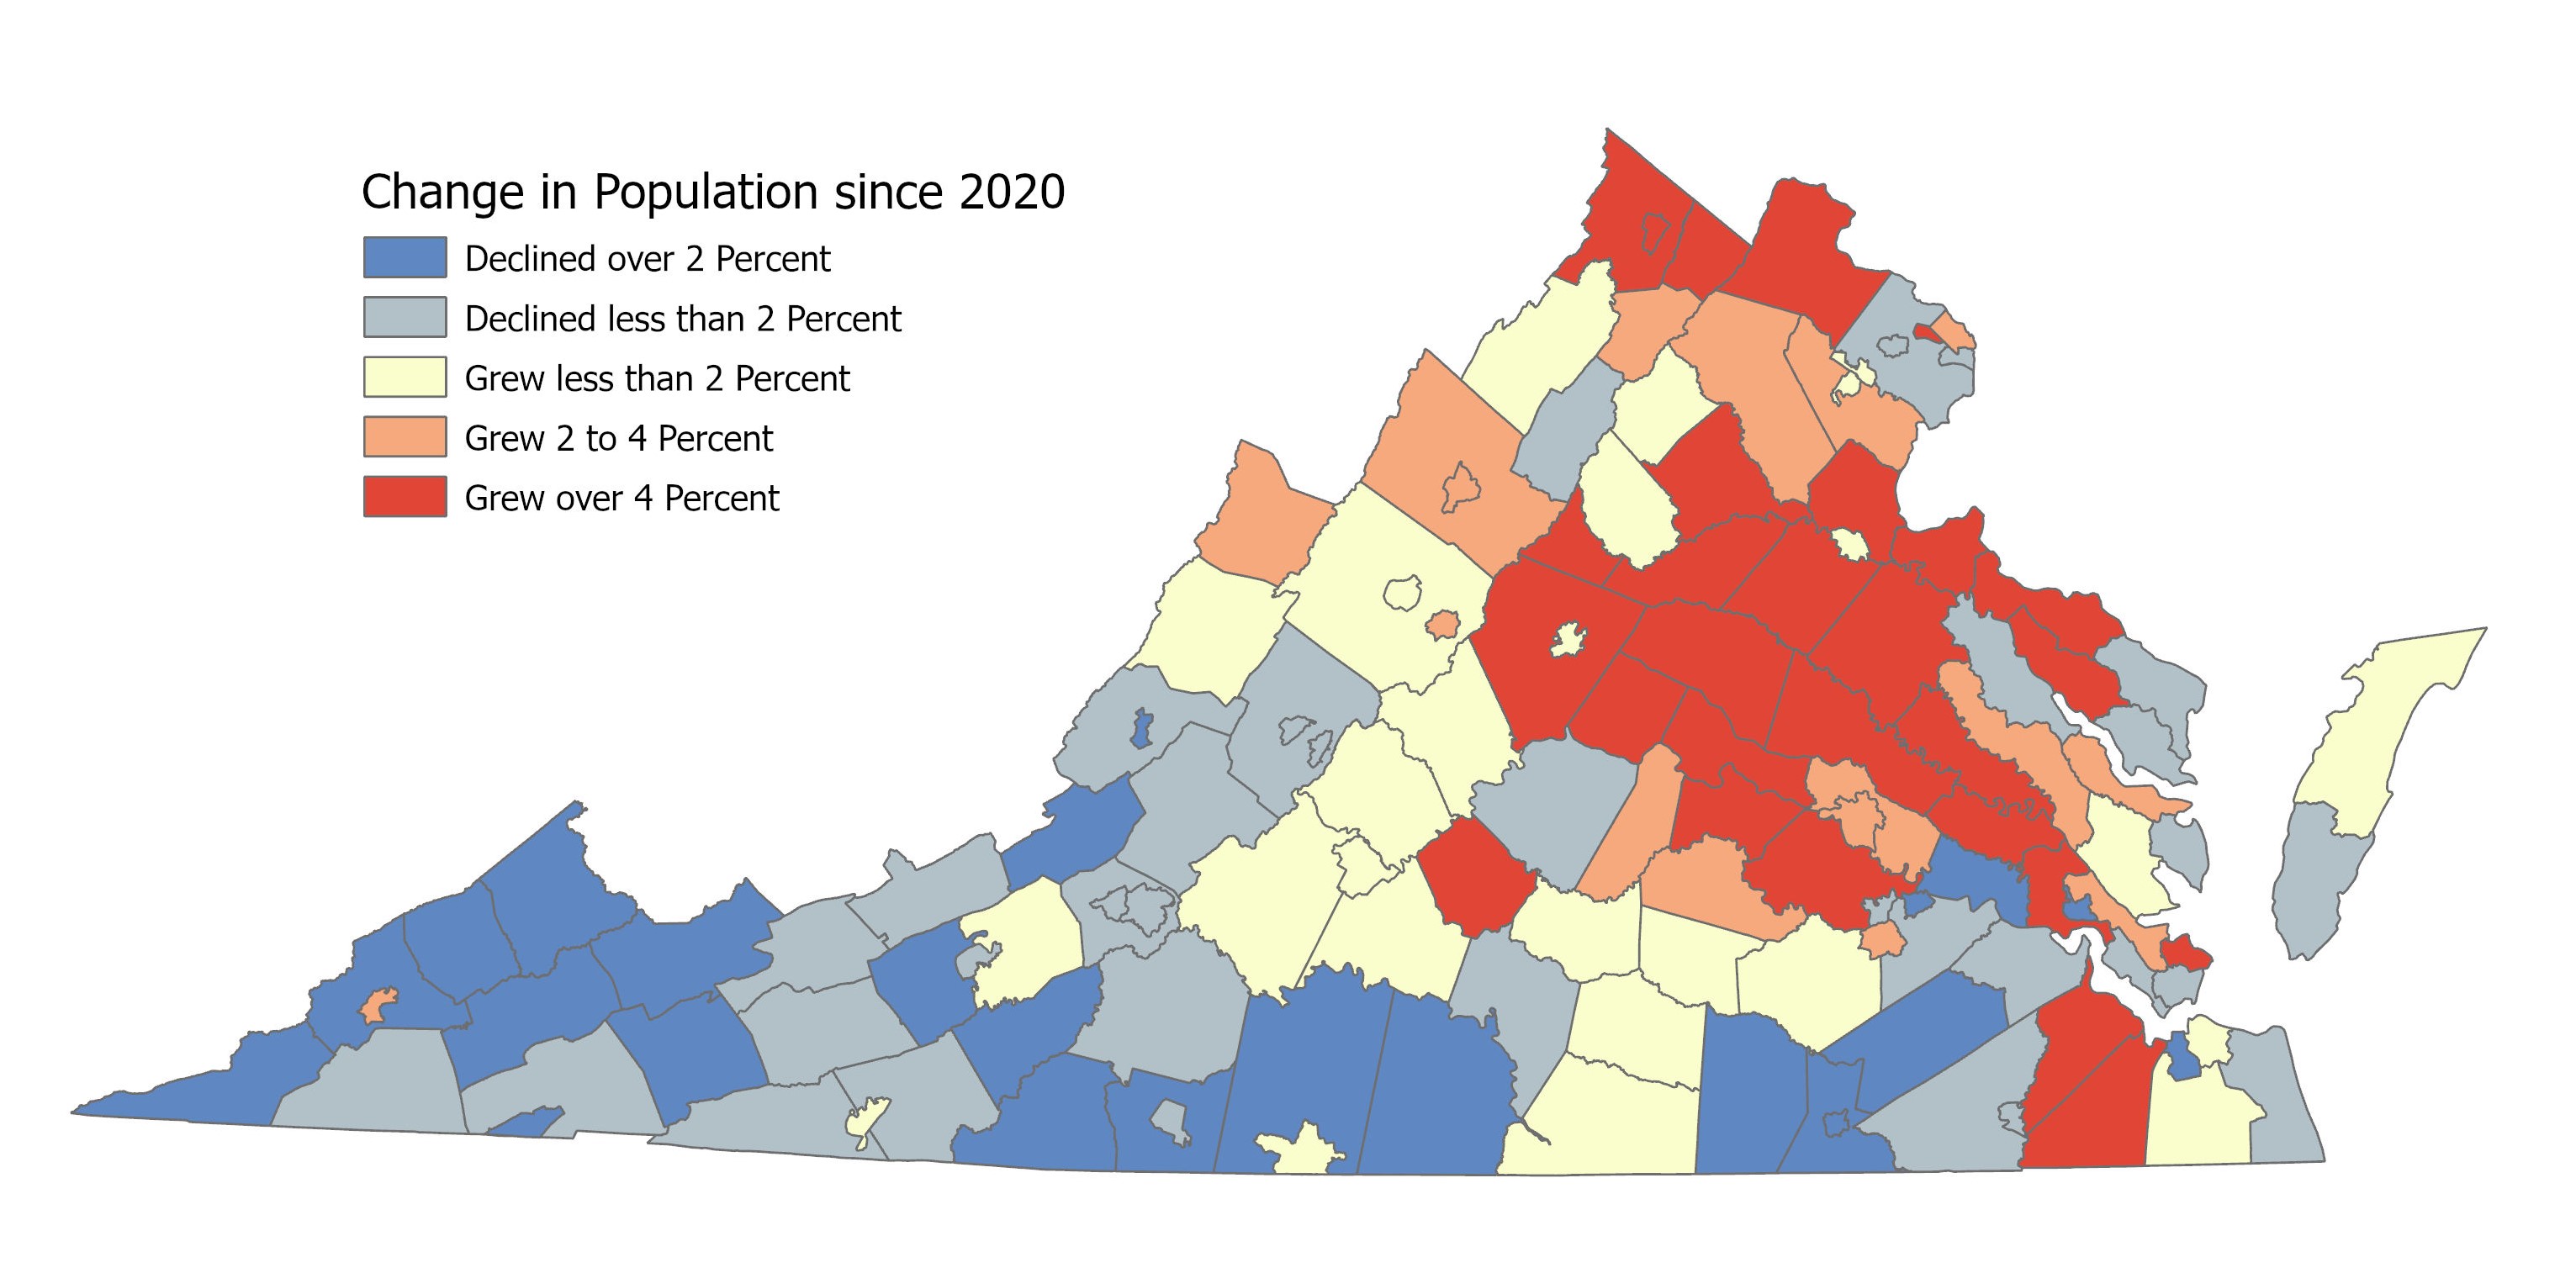

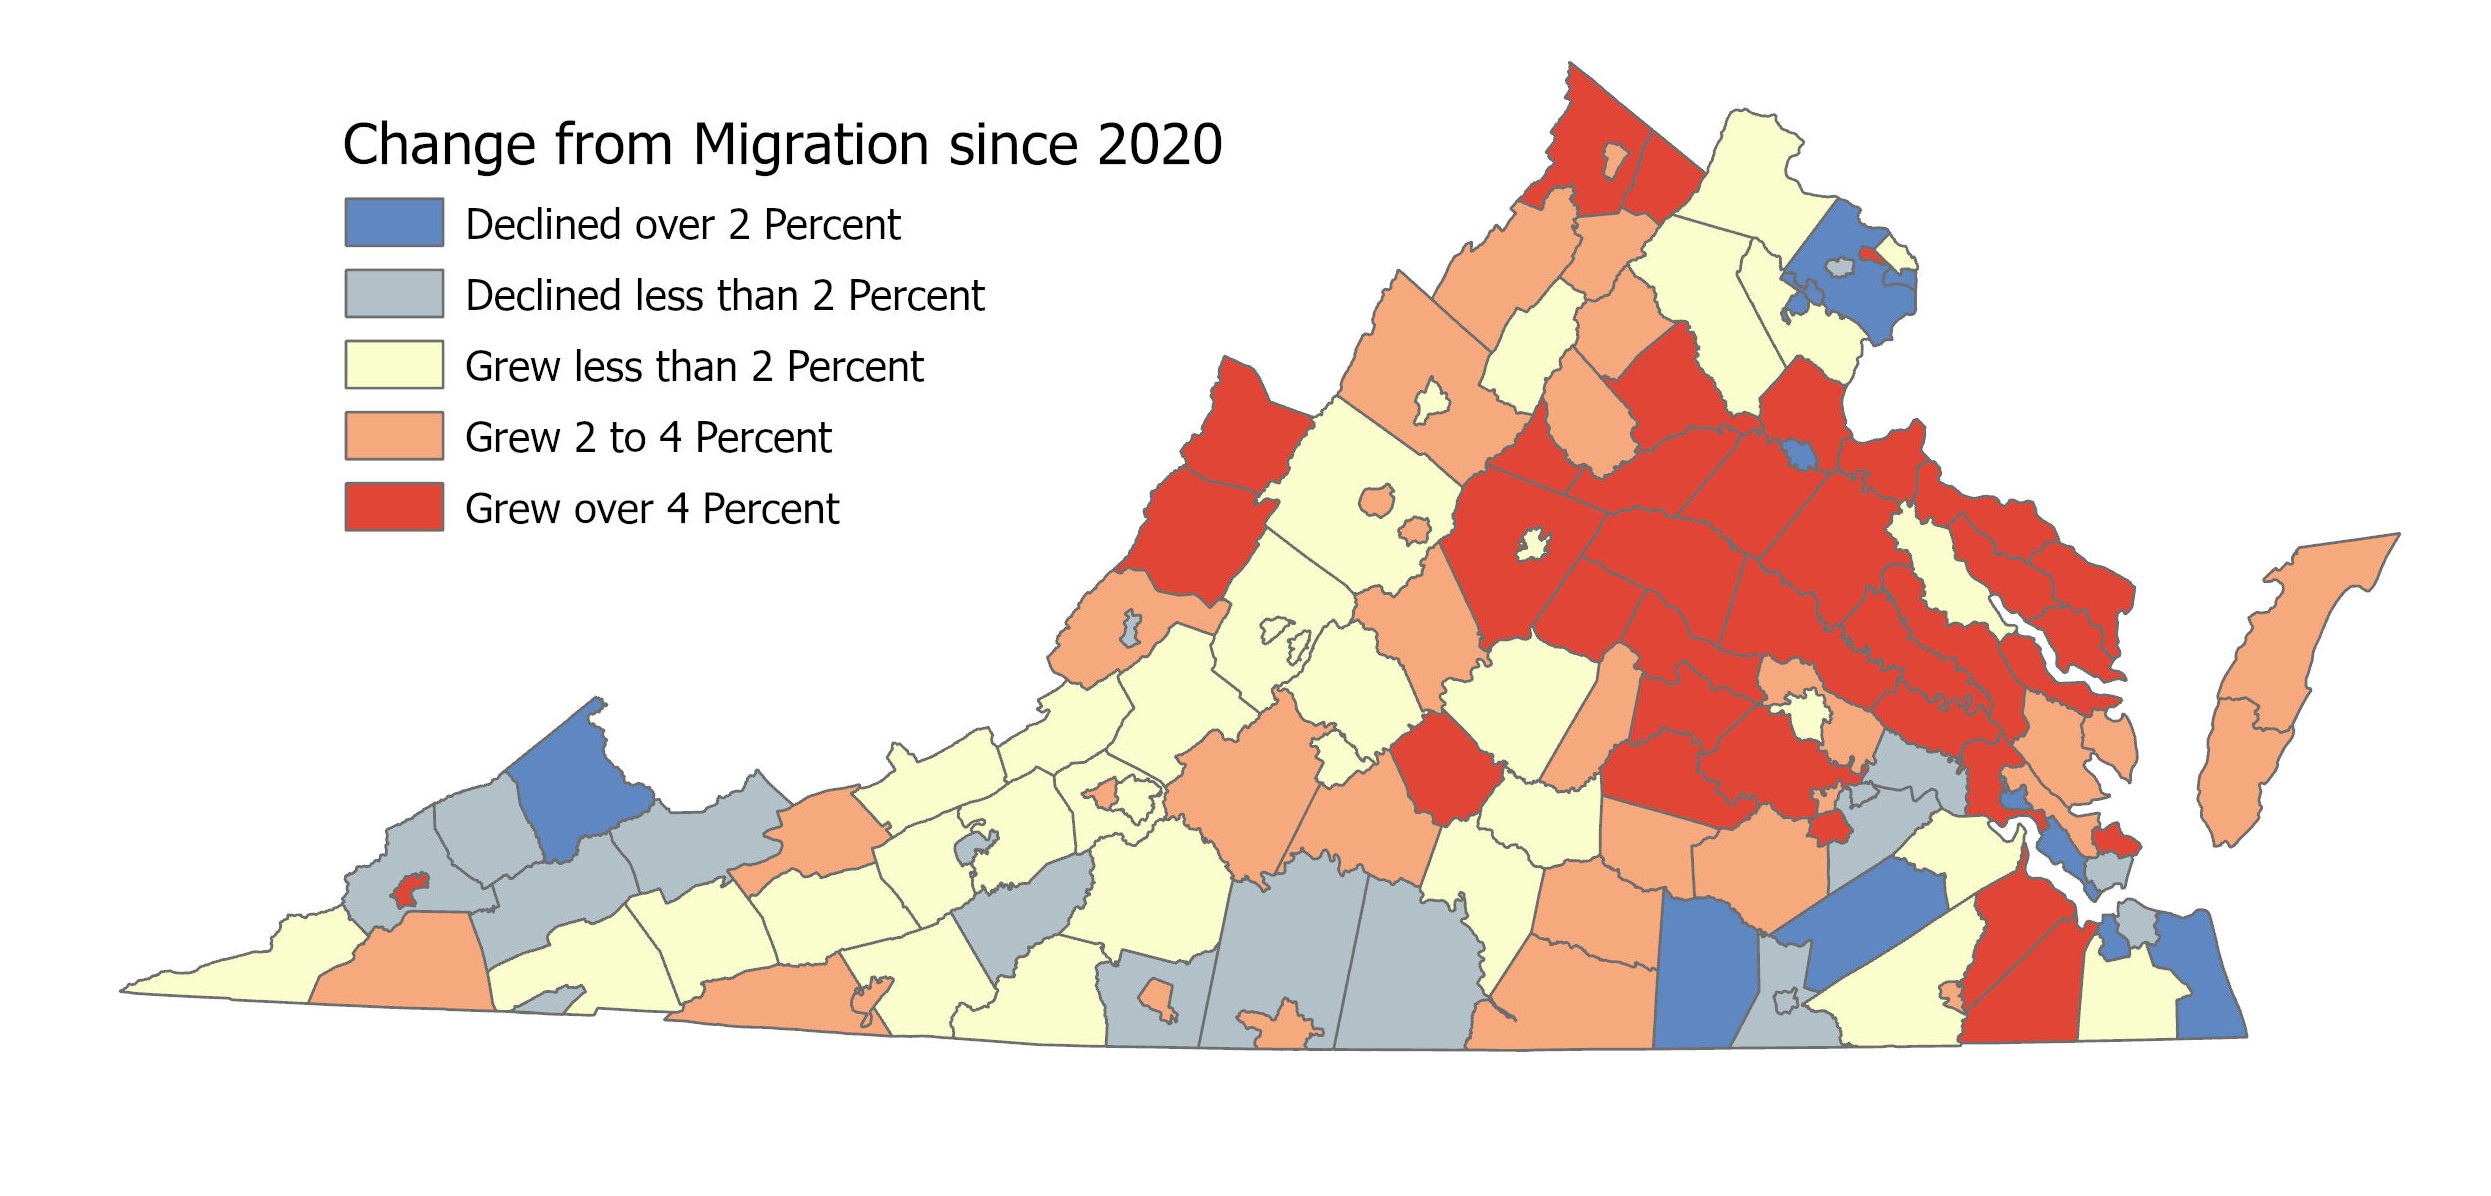
Those maps aren’t the point today, though. Instead, let’s look at another figure: that percentage of the total households that have moved in since 2020, which saw the census overlap with the COVID-19 pandemic, the latter of which appears to have triggered increased migration from large cities to small ones and rural areas.
That percentage of new households gives us a good measure of just how much that pandemic-inspired migration has changed communities. Some of them were gaining population anyway. Others, though, saw net out-migration before the pandemic and now are seeing net in-migration. In some places, that’s caused some communities that were losing population overall to start gaining again — Danville being one of the most notable.
The map below shows what percentage of the total number of households in each locality has moved in since 2020. This is a way to measure the strength of those subsurface currents, even if the surface looks calm, or even if the water level is dropping. (Notice that the measure here is households, not population. Households can be of any size, so these numbers may not align perfectly with population, but this is how the Census Bureau put this data together.)
The locality with the biggest changeovers in population tend to be college towns; no surprise there. The one changing the absolute fastest is hard to see on this map because it’s relatively small geographically: Radford. In that city, 22% of the population is new.
The locality with the second-highest percentage of newcomers is also a college town: In Fredericksburg, 19% of the households are new since 2020. That also likely reflects the super-charged population growth as Northern Virginia pushes further south on I-95. Williamsburg comes n third at 18%.
Many of the localities with a high percentage of newcomers are on the outskirts of Northern Virginia or the outskirts of Richmond, the latter of which is now the fastest-growing part of the state, so both of those make sense.
The more interesting one is Danville, where 14% of the households are new, a higher percentage than in most of the Northern Virginia localities, most of the Hampton Roads localities and all the localities around Richmond. This is further confirmation of the remarkable turnaround in Danville. This was a city laid low a quarter-century ago by the demise of textiles and tobacco. From a high in the 1990 census to 2020, Danville lost nearly 20% of its population. It has now reversed that slide and is gaining population, the result of decades of patient work by city leaders to build a new economy based on advanced manufacturing.
Danville’s overall population growth is still quite low — 0.3% — but that’s because of the same thing Mecklenburg and other places have: an older population that’s dying. The real story in Danville is how many people are moving in. The city has seen a net in-migration of 1,533, which is the highest in all of Southwest and Southside. You have to go north to Albemarle County or east to Suffolk to find numbers larger. That net figure, though, obscures the actual number of people moving in. While the Census Bureau doesn’t provide that number, we can divine something close from the separate census data that computes the percentage of new households. That 14% for Danville translates into 5,978 people who have moved into the city since 2020. Former President Ronald Reagan was fond of saying that people “vote with their feet” by moving to successful communities. These figures represent a huge vote of confidence in Danville. That helps explain why, when Cardinal expanded its staff beyond our initial two reporters, the first additional reporter was in Danville. There’s a lot happening there, and Grace Mamon has covered a lot of the changes taking place in the city, from the growth of the indoor agriculture industry to the conversion of old factory buildings into new housing. (We now have nine reporters from Richmond to Bristol, with a 10th coming this summer.)
Another place that pops out on the map is Montgomery County, where 14% of its population also consists of newcomers. Colleges skew the numbers because college students are always moving in and out. Virginia Tech students aside, there is obviously a lot of non-college population growth taking place in Montgomery County; just drive down Peppers Ferry Road south of Christiansburg and you’ll see fields blooming with new apartment complexes. Montgomery County, though, has been gaining population in every census since 1900, so this figure isn’t nearly as surprising as the Danville one.
Another place that stands out in Southwest Virginia is Carroll County. Since 2020, 11% of the population is new. Carroll is one of those places where the population is declining — it’s down 3% — but the county is seeing large numbers of people move in, just not enough to match all those deaths. In Southside, Prince Edward County stands at 10%; some of that is surely driven by the presence of two colleges — Hampden-Sydney College and Longwood University.
The counties impacted the least by the post-pandemic migration are all mountainous localities along the state’s border with West Virginia. In Alleghany, Bland and Highland counties, just 3% of the population since 2020 is new. In Bath and Craig counties, the figure is just 1%.
I’m struck, though, by Buchanan County. The coal-producing county has historically seen the biggest population declines in the state (although now it’s second behind Sussex County). Buchanan is one of those unfortunate communities that’s losing population two ways: Deaths outnumber births and more people are moving out than moving in. Nonetheless, 6% of its population since 2020 is new, which tells me that a surprising number of people are moving into the county. They just have to spend too much time waving at all the people still moving out.
Cardinal publishes six newsletters, one daily, four weekly and one monthly. You can sign up for any or all of them here:
