


We often think of the peak temperature in the afternoon as the defining mark of summertime heat.
Cardinal News reporters this week are measuring temperatures at reader-identified local hot spots to illustrate how subtle factors can raise heat stress to individuals in localized areas. See their results here.
But there is another number that can be measured which determines how oppressively sticky it feels, and there is also another end to the daily temperature cycle that can be just as important as daytime highs in defining heat stress for humans.
According to the NOAA dictionary, the dew point is “a measure of atmospheric moisture. It is the temperature to which air must be cooled in order to reach saturation (assuming air pressure and moisture content are constant). A higher dew point indicates more moisture present in the air.”
Dew point is a more stable and effective measure of lower atmospheric moisture than is the more commonly cited relative humidity, which varies with the same amount of moisture as temperature changes. A dew point of 70 combined with a temperature of 72 Fahrenheit indicates a relative humidity of 93%, whereas a dew point of 70 with a temperature of 95 F produces a relative humidity of only 44%, even though the level of water vapor in the air is the same in both.
Sticky weather pattern
In late June through much of July, a weather pattern developed in which strong high pressure centered east of the United States near Bermuda swept in abundant tropical moisture very far to the north, bringing unusually high surface dew points even into some of the northern states. In Virginia, we have experienced many extremely sticky days with 70 to 75 dew points, sometimes a little higher, as daily high temperatures have often been hot but not extraordinarily so.
This acute cause of stickiness and sogginess mixing with this summer’s heat comes on top of studies showing a more chronic general rise in surface dew points as the world’s oceans have warmed and air off those oceans flows inland. 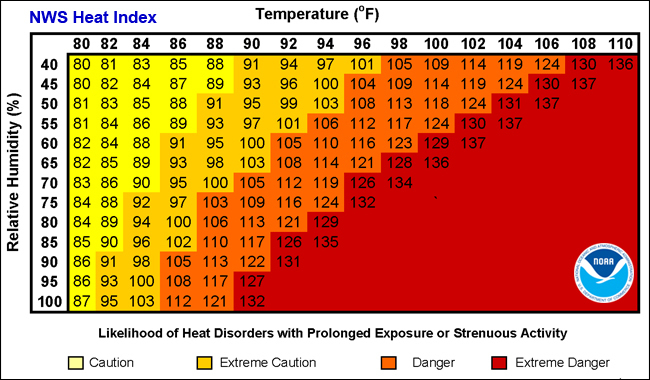
Higher dew points raise the discomfort level of daytime heating, as the human body’s perspiration evaporates at a slower rate into moist air than it does drier air, therefore cooling the body less.
One commonly cited means of estimating that bodily discomfort is called the heat index (calculator linked here), which calculates approximately what temperature the moisture level in the air will make it “feel like.” That 95-temperature, 70-dew-point example previously cited might only be 44 percent relative humidity, but it registers a heat index of nearly 102 degrees, fully capable of causing heat exhaustion or even heat stroke to those not properly hydrated and taking appropriate shaded rest breaks. 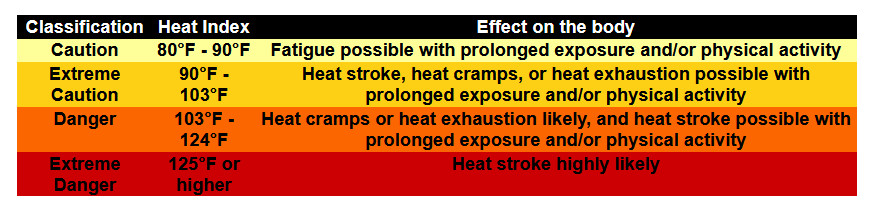
This chart shows potential health effects at various heat index levels. Courtesy of National Weather Service.
Another means of higher dew points increasing heat stress in individuals is that nighttime low temperatures do not drop below the dew point. Higher dew points mean warmer overnight lows.
In practical terms, people living in “hot spots” in their communities who do not have air conditioning or proper ventilation do not recover as well at night when temperatures hang in the 70s rather than drop to the 60s, which has been the long-term summer norm in most locations in our region. 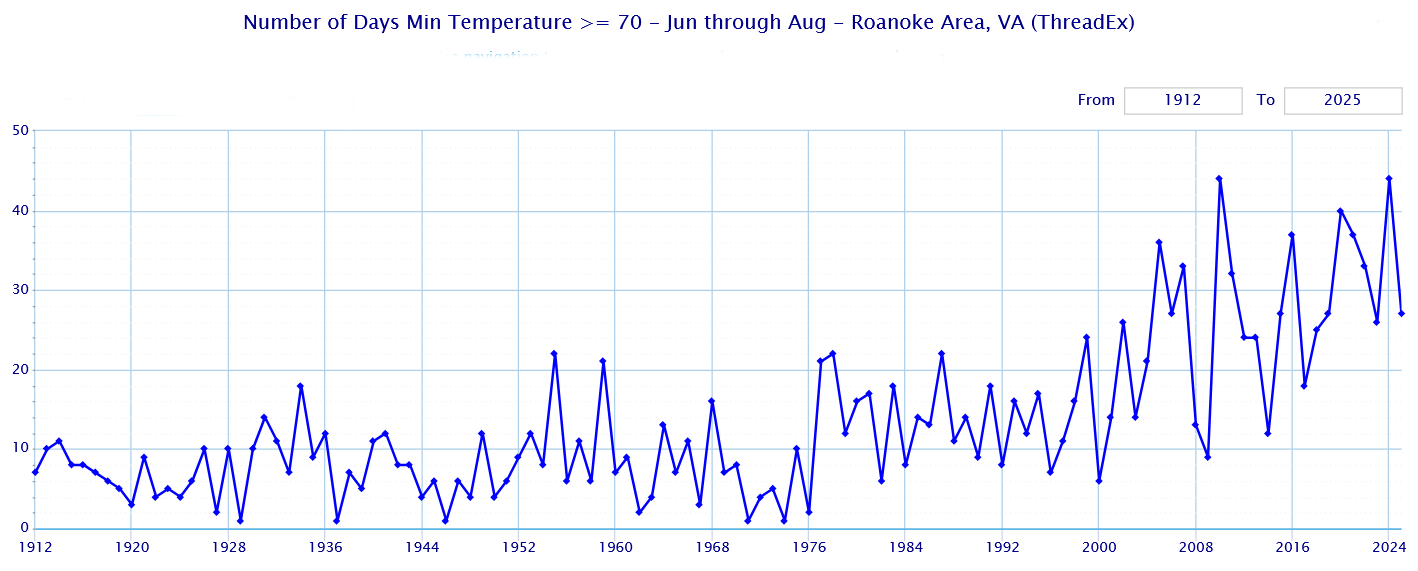
Are our nighttime lows getting warmer?
Various studies have found that overnight low temperatures are steadily getting warmer during the summer months in much of the United States, often outpacing any rise in summer high temperatures. This is considered a broad impact of global climate change.
Of course, these effects vary year to year with changing weather patterns, and also vary between regions and localities based on myriad factors.
Nowhere in the Southwest and Southside Virginia region covered by Cardinal News more dramatically illustrates a trend toward warmer nights than its most populous metro area at Roanoke.
In 1999, Roanoke had what was at that time a record 24 summer nights with low temperatures of 70 or above, only the fifth summer since the start of consistent local official weather data in 1912 with 20 or more nights staying above 70.
But since 2000, 18 summers have had at least as many nights as the 24 in 1999 with lows of 70 or above, including the current summer that had 28 such daily low temperatures through Monday with still a little more than a month to go. (Summer here is meteorological summer, June 1 to Aug. 31.) Last summer had a record-tying 44 days with lows of 70 or above, equaling the previous mark set in 2010. 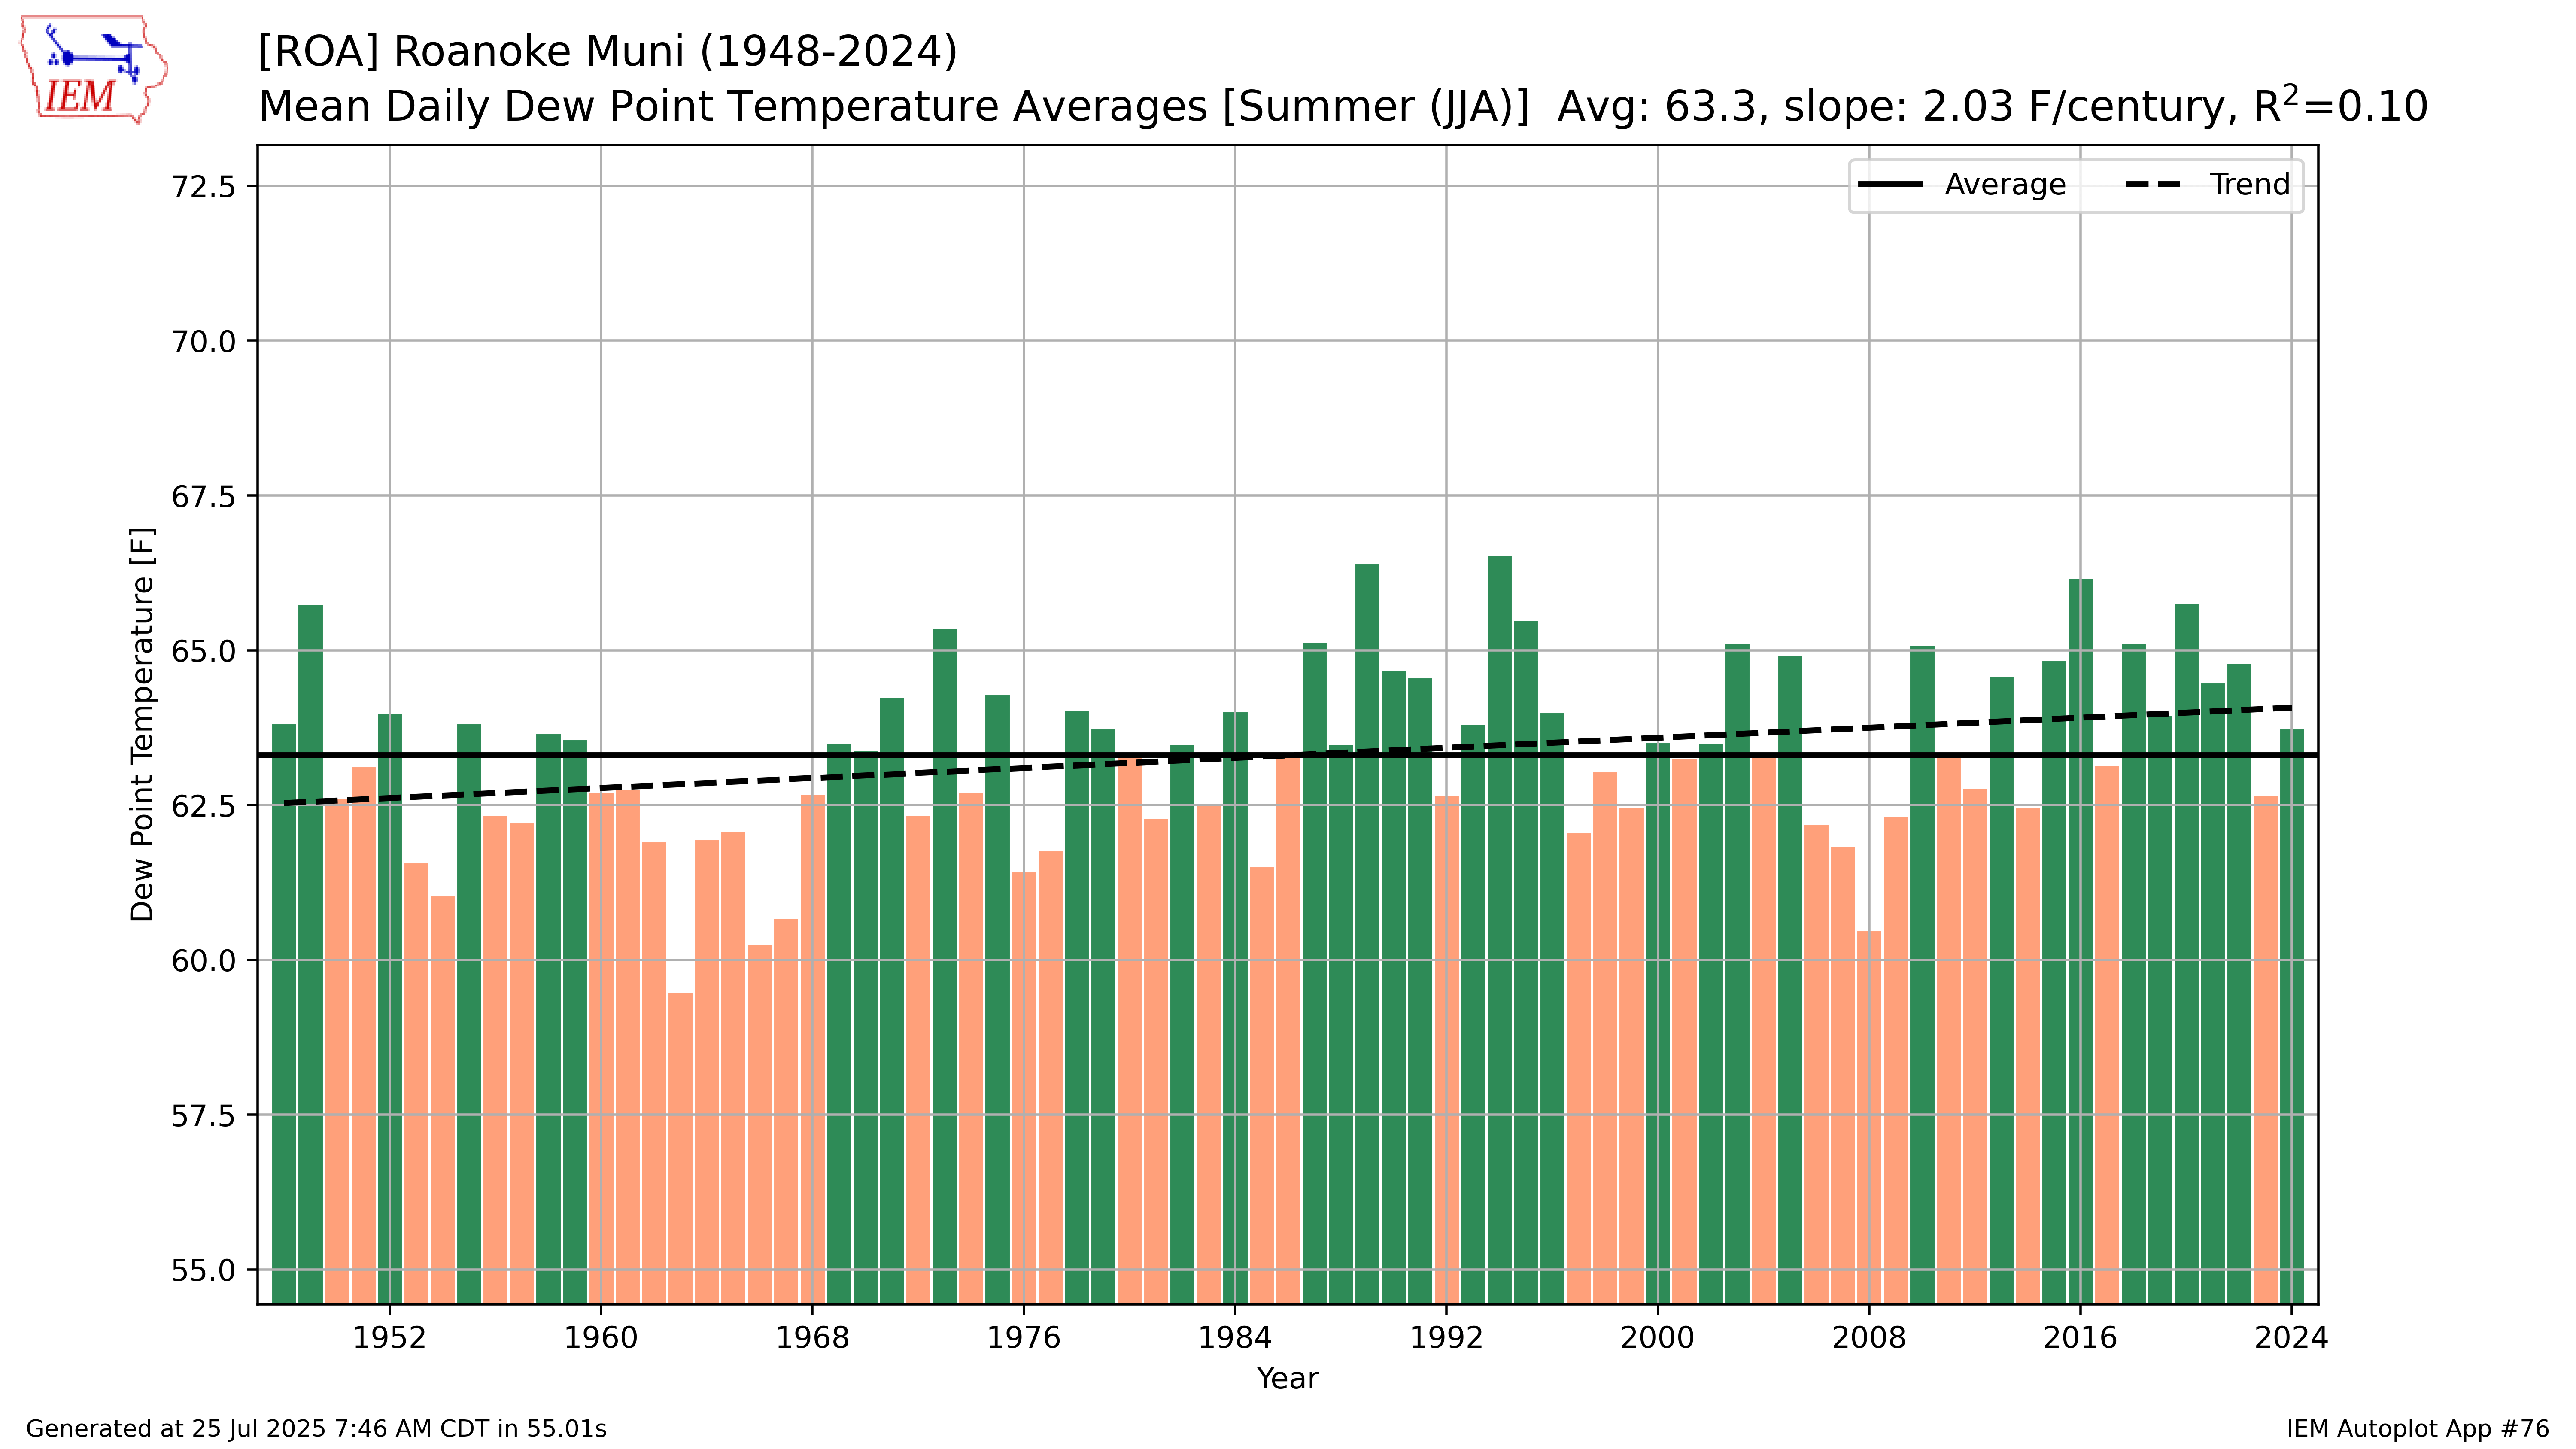
Higher dew points are only part of the issue with the warmer low temperatures specific to Roanoke. Data shows a clustering of recent summers with average dew points above the long-term average (going back to 1948, in this case) of 63.3, as 9 of the past 12 summers have been above this mark in the Star City. But there was a similar clustering of high dew-point summers in the later 1980s to mid 1990s that did not manifest with as many warm nighttime lows.
It is likely that increased urban growth around the sensor site, at what is now the Roanoke-Blacksburg Regional Airport, is a heavy contributor to frequently warmer low temperatures at the site. Areas around the airport that were farms and pastures even into the late 20th century are now shopping centers, hotels, parking lots, and other forms of commercial development, with the construction of Valley View Mall in 1985 as a turning point. Concrete and asphalt hold in more daytime solar warming and release it more slowly at night, a phenomenon known as “urban heat island” warming that commonly keeps urban areas warmer than surrounding more rural areas. 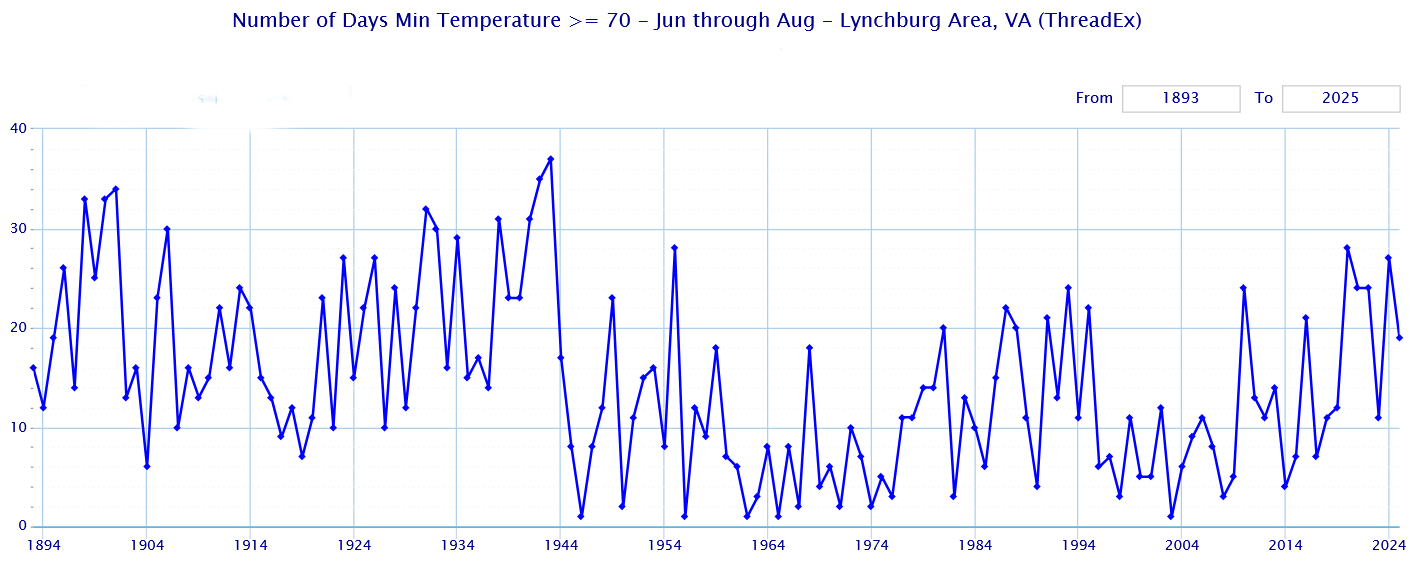
Lynchburg provides something of a counterexample, as its official sensor site was moved from downtown to the airport at the south edge of the city in the mid 1990s. After a period in the mid 1980s to early 1990s when multiple years had 20 or more nights withs lows 70 or above, there is not as a sudden dropoff once the official sensor site was moved to a less developed part of the city, and nights with lows in the 70s did not top 20 between 1995 and 2010.
Since then, warm nights have become more common again at the official Lynchburg weather station, with five of the last seven summers counting this one having had 20 or more nights with lows 70 or above, this summer recording its 20th on Monday, and still counting. The recent high point of 28 nights 70 degrees or above in 2020 still trails several years with more than 30 nights above 70 in the 1930s and 1940s.
Urban growth southward may play a role in the recent spike of warm nights, but Lynchburg’s recorded dew points have topped the long-term average (also going back to 1948) of 63.4 in the past 13 summers, with high points topping 66 in 2016 and 2020. 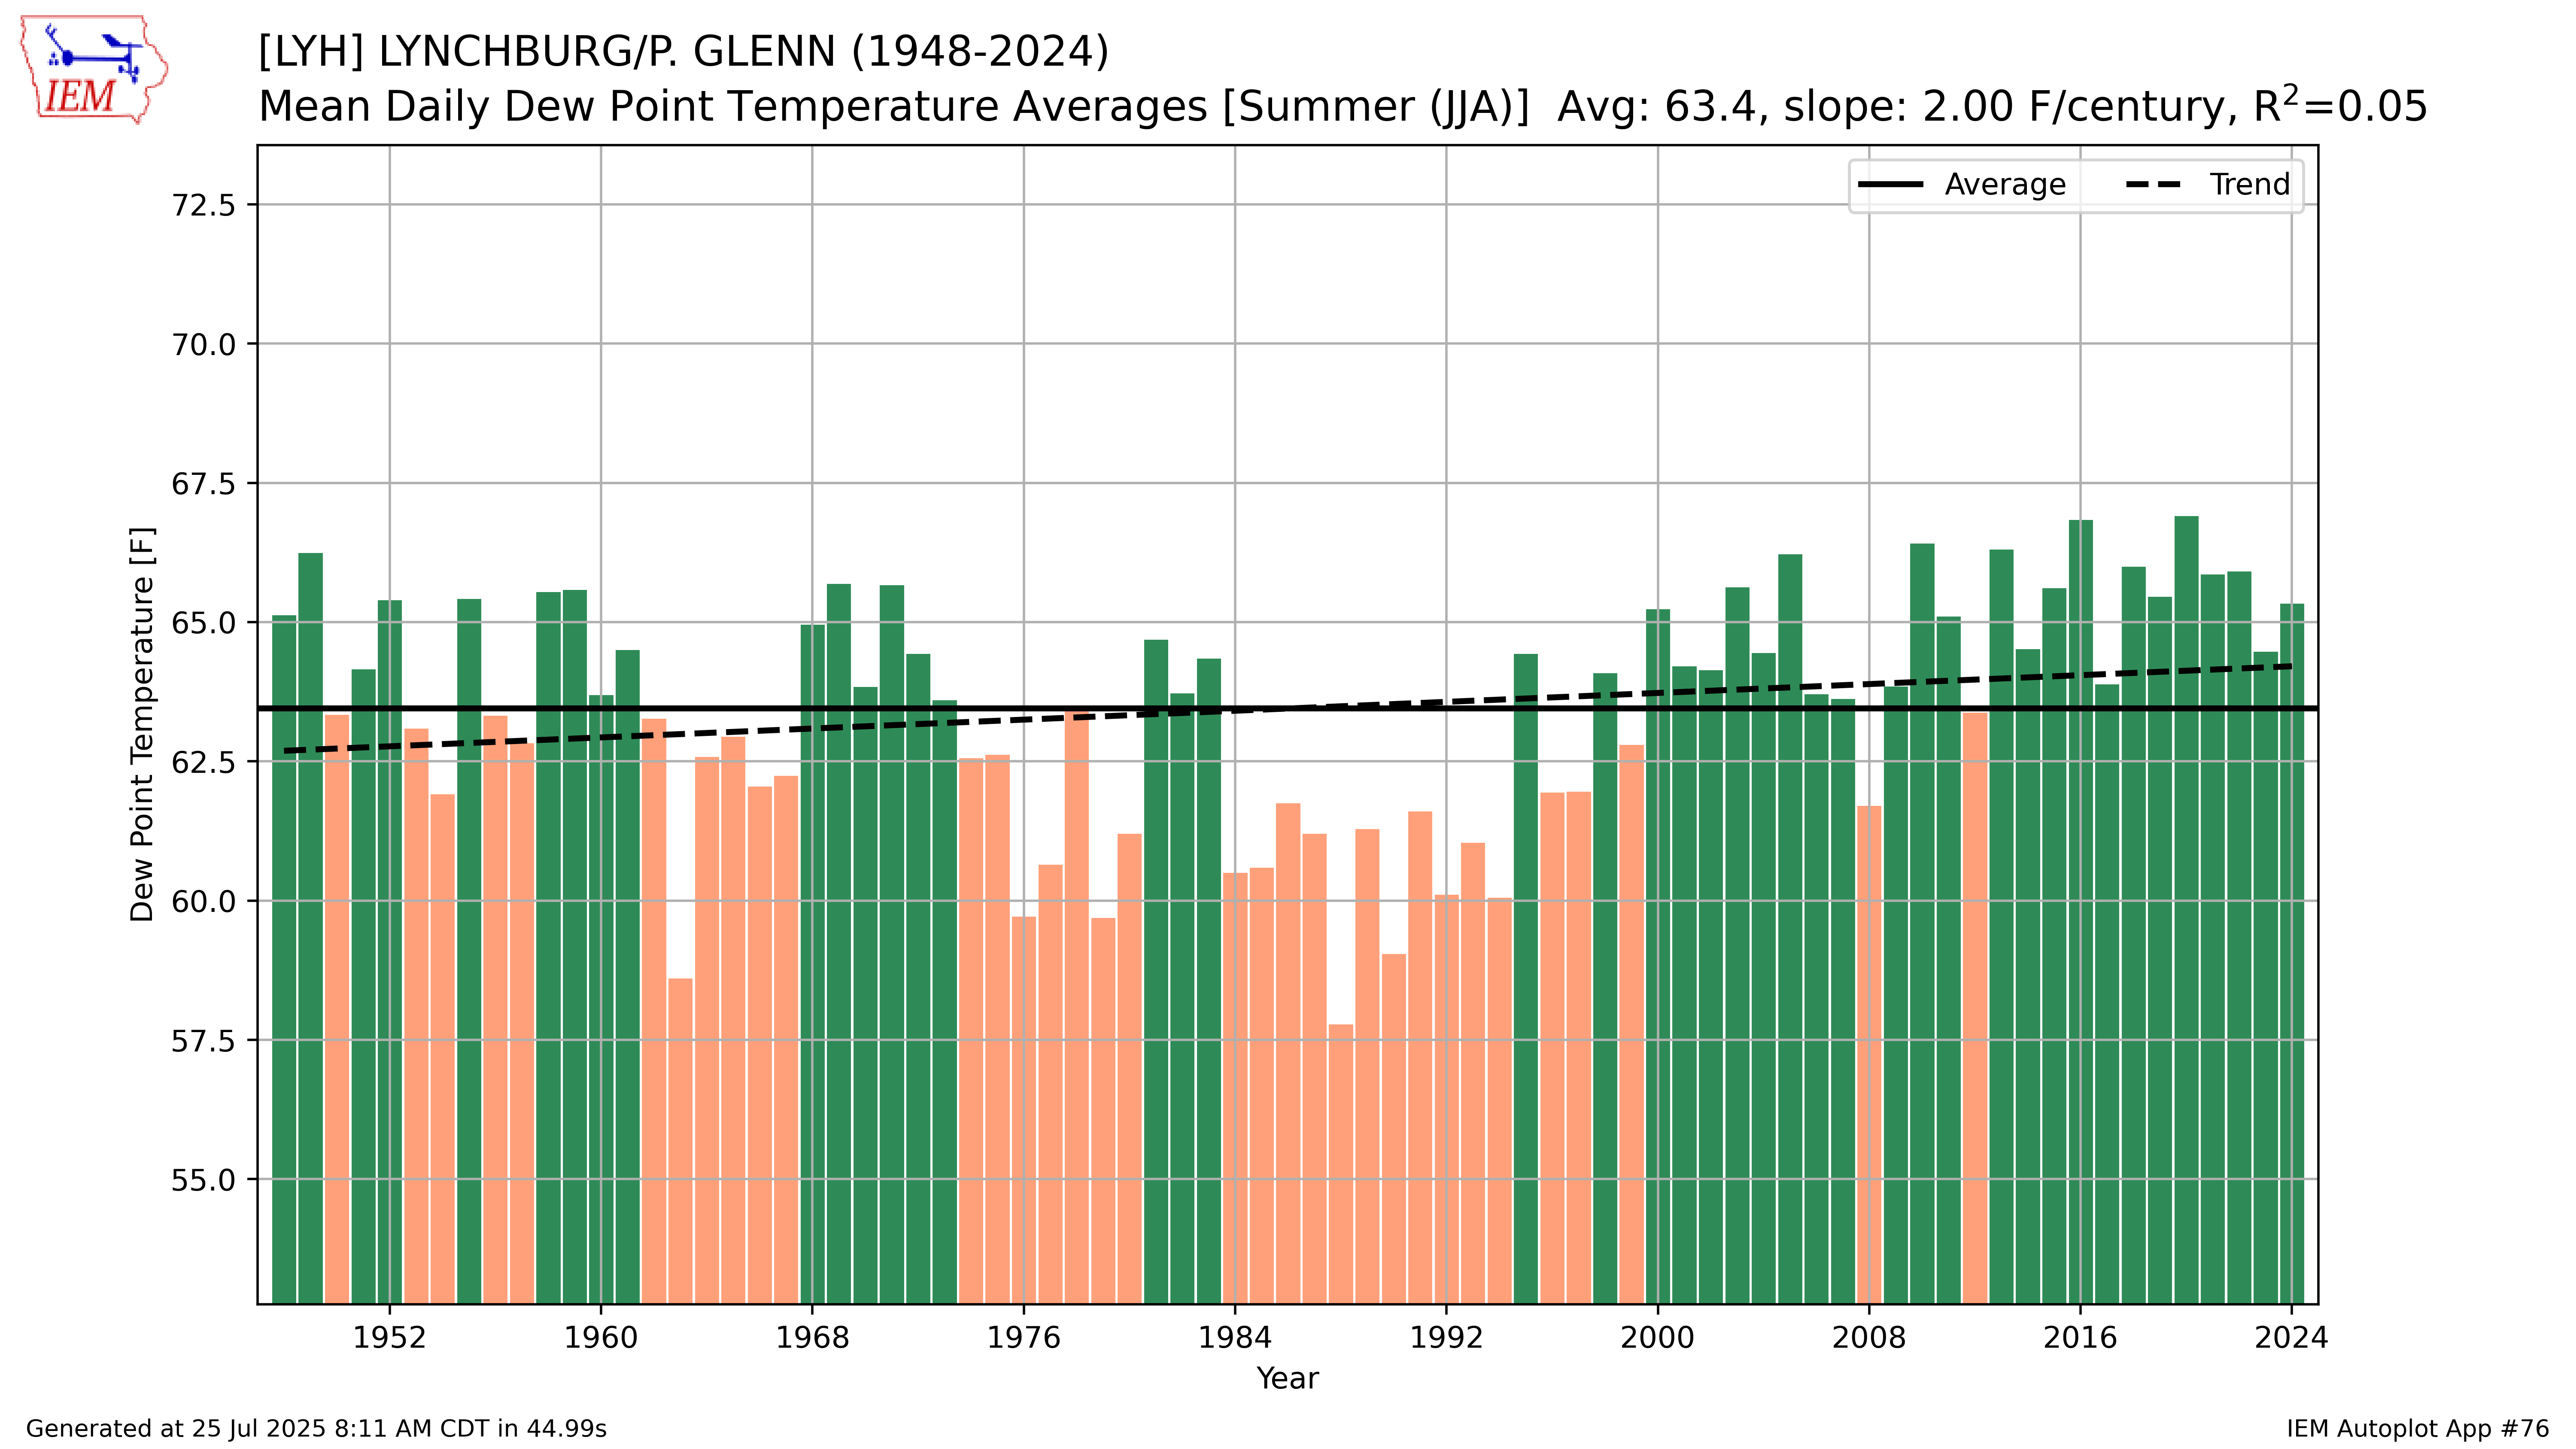
Danville has also shown a recent spike in warm nights, with 46 nights with lows 70 or above in 2010, the most since the start of official data in 1917, and six of the last 13 also having 30 or more, 2025 becoming the latest hitting 30 on Monday.
The data on warming nights is more inconclusive as we move into the more mountainous western parts of our region.
Blacksburg rarely has lows 70 or above, but has had half of its 12 summers with at least 25 nights of lows 65 or above since 2005, though the 1930s and 1940s tend to have had more warm nights according to the data.
Wytheville had 38 nights with lows of 65 or above in 2020, trailing only the 41 in 1934. Like Blacksburg, the 1930s and 1940s era tended to have more warm nights than recent years.
Abingdon has not had any nights with lows 70 or above most years since its records begin in 1973, but spiked to 22 such nights in the summer of 2022. All other summers with at least a couple of nights 70 or above have happened since 1999.
Burke’s Garden and Lexington, which each have data dating back to the 1890s, generally aren’t showing much of a recent trend to warmer nights. (Here’s another reminder that Lexington has been without a cooperative weather observer for a year. Call the National Weather Service office at Blacksburg at (540) 553-8900 or email at rnk.webmaster@noaa.gov if you live in the Lexington area and have an interest in resuming one of our region’s longest running periods of weather data.) 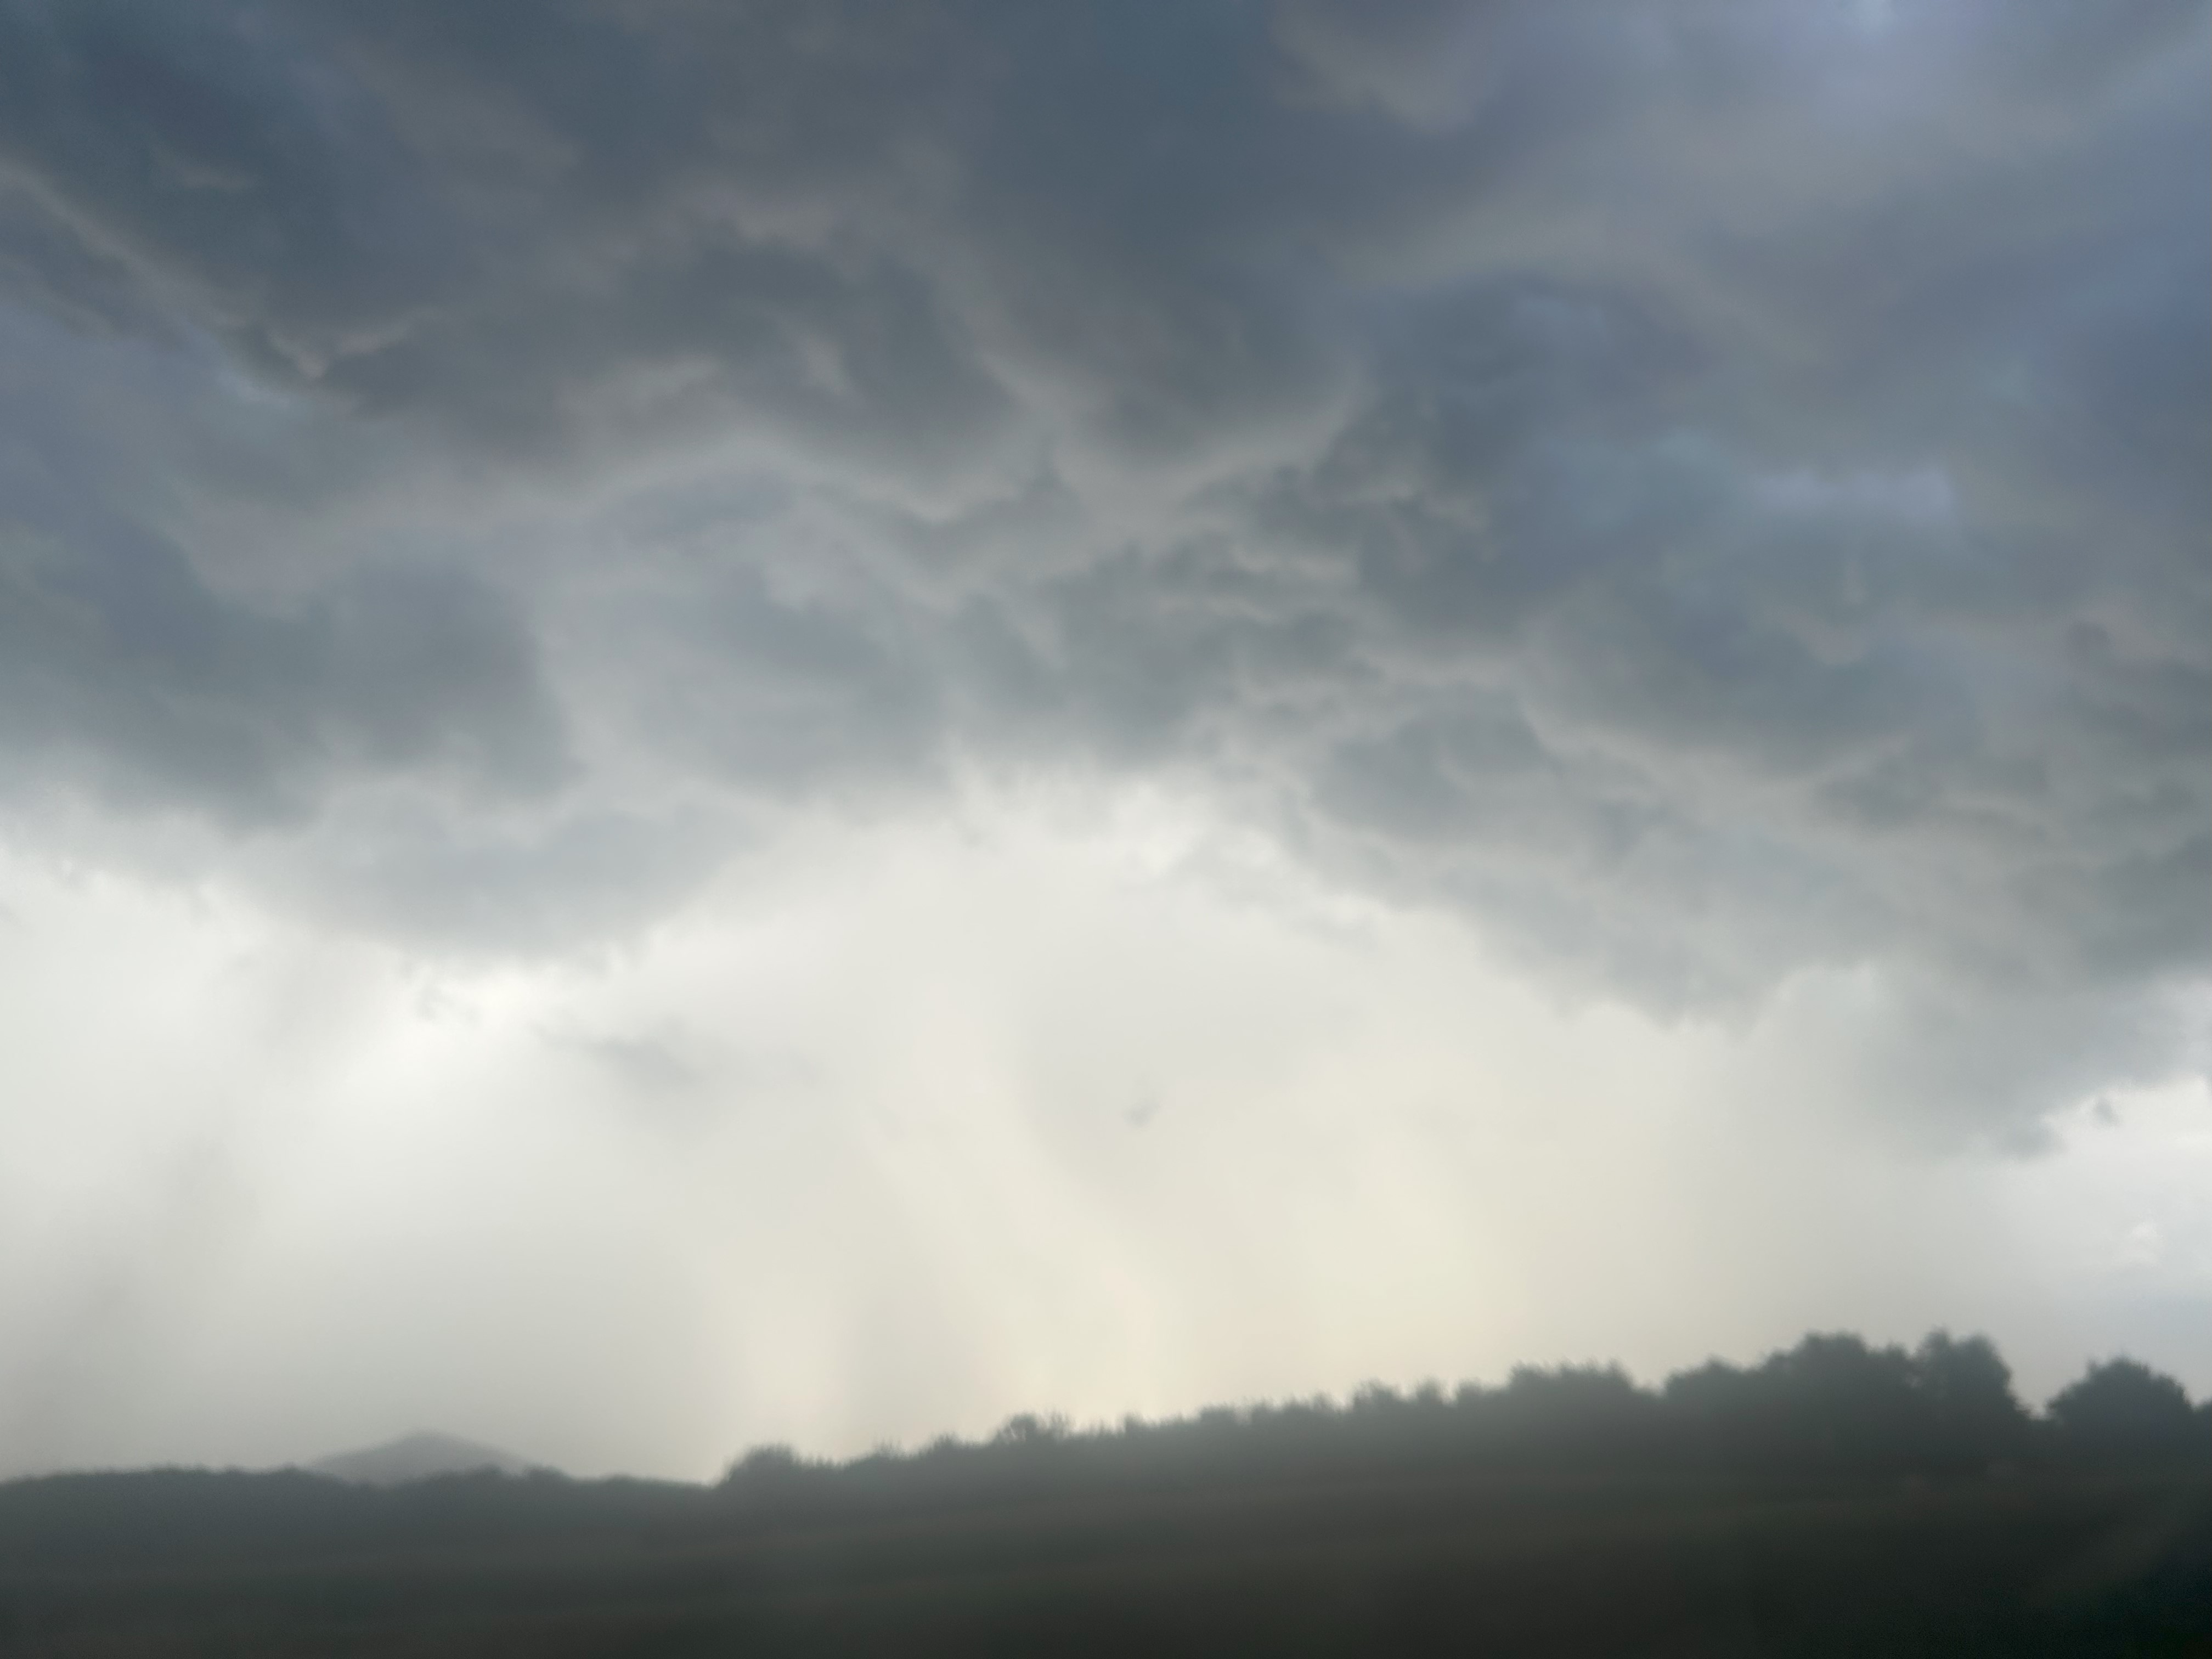
More clouds and storms
Ironically, higher dew points can help cool the air in at least one way, as greater moisture content in the air fuels the development of clouds, showers and thunderstorms.
The clouds block the sun, and the rain and outflow winds from showers and storms cool temperatures under and near where they develop or move.
In recent days, the effects of afternoon storm development have taken the edge off potential heat in our region, with high temperatures mostly in the upper 80s to mid-90s, not pushing toward 100.
Stormy weather comes with sticky conditions that we have labeled as “sticky-stormy” in this space. And that is where we are presently.
But there are signs of an abrupt change in the sticky-stormy weather pattern, which we’ll discuss in Wednesday evening’s weekly Cardinal Weather column.
Journalist Kevin Myatt has been writing about weather for 20 years. His weekly column, appearing on Wednesdays, is sponsored by Oakey’s, a family-run, locally-owned funeral home with locations throughout the Roanoke Valley. Sign up for his weekly newsletter:
